
Working in different areas as a developer requires you to emphasize on different features of a website. A lot depends on who and for what purpose is the product made for. If a website is made for public, performance and speed should most probably be in the focus. With more and more people getting access to internet, the number of online websites are increasing every day. This means more competition and that moves the spotlight to website properties which were not at all important 10-15 years ago.
Search engines nowadays are also focusing more on user experience then ever before. The position of your website depends highly on the performance, speed and responsiveness. According to Moz, analysis of Google shows that over 90% of clickthroughs are from the first page results. Fighting to be on the first page is a must for a successful business. There are many tactics and solutions on how to achieve good positions, but all experienced SEO consultants agree that UX matters most.
CASE STUDY: IMPROVING MYCALL.NO
Nowadays the mobile matters more, and desktop website requirements are not really strict. Focusing on mobile testing most of the time solves all desktop issues too, so the performance improvement results are mostly based on finetuning for mobile devices. Improving MyCall.no seemed to be an interesting task. Most of the time if the developer faces a problem its wise to draw an action plan, which can be closely followed. This makes sure that the provided solution is structured and thoughtful. The steps should almost always include:
- Analysis.
- Research.
- Solution with explanation.
- Conclusion.
ANALYSIS OF MYCALL.NO
Tools used for analysis
There are several online tools that are available for analysing a website. In addition there are also built in browser provided extensions and tools that can help to find the issues with a site's performance. Recommended tools include
- Local built in tool: Lighthouse in Chrome DevTools
- Lab environment test tool: web.dev Measurement Tool
- Field performance test tool: PageSpeed Insights
- WebPageTest.org test tool: WebPageTest.org
Note: test results differ based on several factors including
- Server load.
- Location of the test.
- Network latency.
It is very important to know what is the content you are testing and what tool to use. This article's focus is not on PageSpeed Insights, but it is at least important to explain the difference between field and lab testing. The lab tests are done in a controlled environment with predefined device and network settings. The field performance tests are based on data collected from the real users visiting your site. To find the general performance flaws of a website it is recommended to analyze it with the lab test first. And then after giving it some time, it is advised to look into the field data and make assessment based on it later.
After understanding the difference between lab and field testing to create and try to solve general performance issues, first step should be to assess with lab environment testing: web.dev Measurement Tool. The other recommended tool is provided by WebPageTest.org, which is a very helpful free online service, where you can customize testing locations and get very thorough test results.
Analysis results
The analysis result shows 24 points out of 100, and the page load time is around 4-5 seconds. There is much room for improvement.
WebPageTest.org - analysis:

web.dev PageSpeed Insights lab test - analysis:

Conclusion of some of the mayor issues found after the analysis:
- Many render-blocking elements.
- Scripts are not deferred, each delaying load, React is not prerendered.
- API is not using compression.
- High server response time.
- Low expiry time of assets.
- ACE chat is causing high overhead.
- Google Tag Manager also causing high overhead.
- CSS is not split up and not deferred.
- There is no proper web cache.
IMPROVEMENT STEPS
Take it easy - Always take one step at a time. Better to do things slowly and consider the next step wisely, cause everything is connected. It can easily happen that you improve one thing and you don't see any results, because another unsolved issue. As a simple example a huge code improvement can have zero affect if you have an unoptimized hero image. You should know what you are doing and understand how the different elements of a website are loaded.
Improvement step nr. 1.
The website has some Jquery code, which was not included in the main javascript bundle. As a part of this step, these pieces of code were moved into the main JS bundle. As a very important improvement, the defer attribute was also added to all loaded JS files.
<script src="/exampleScript.js" defer></script>The analysis showed that the API responses did not have any compression. Adding compression was inevitable and the only question was about the type. After testing the most effective brotli compression, results showed that the gain it had over gzip was insignificant, as a result of this the latter was the suggested implementation.
<IfModule mod_deflate.c>
  AddOutputFilterByType DEFLATE text/html text/xml text/css text/plain
  AddOutputFilterByType DEFLATE text/javascript application/javascript application/x-javascript application/json

  # Remove browser bugs (only needed for really old browsers)
  BrowserMatch ^Mozilla/4 gzip-only-text/html
  BrowserMatch ^Mozilla/4\.0[678] no-gzip
  BrowserMatch \bMSIE !no-gzip !gzip-only-text/html
  Header append Vary User-Agent
</IfModule>
Speaking of compression, the frontend provided assets' compression is also recommended and was added as part of this step.
<IfModule mod_deflate.c>
    AddOutputFilterByType DEFLATE text/text text/html text/plain text/xml text/css application/x-javascript application/javascript image/svg+xml text/javascript image/jpeg
    # Fonts:
    AddOutputFilterByType DEFLATE application/x-font
    AddOutputFilterByType DEFLATE application/x-font-opentype
    AddOutputFilterByType DEFLATE application/x-font-otf
    AddOutputFilterByType DEFLATE application/x-font-truetype
    AddOutputFilterByType DEFLATE application/x-font-ttf
    AddOutputFilterByType DEFLATE application/x-font-woff
    AddOutputFilterByType DEFLATE application/x-font-woff2
    AddOutputFilterByType DEFLATE font/opentype
    AddOutputFilterByType DEFLATE font/otf
    AddOutputFilterByType DEFLATE font/ttf
    AddOutputFilterByType DEFLATE font/woff
    AddOutputFilterByType DEFLATE font/woff2
</IfModule>
The results were promising:
Performance improvements step1 - WebPageTest.org results:

Performance improvements step1 - web.dev PageSpeed Insights results:

Improvement step nr. 2.
Spotting the overhead caused by the chat application was an important part of the performance issues. This led to the realization of wrong script load order. ACE chat was loading ahead of more important scripts, that were needed for generating the website layout. Adding async attribute and moving it after necessary scripts helped a lot.
<script src="/exampleScript.js" async></script>As a part of this step the expiry time for static assets (images, fonts, scripts, style sheets etc.) were increased to the Google-recommended values.
<IfModule mod_expires.c>
    <FilesMatch "\.(js|css|jpg|jpeg|gif|png|svg|ttf|ttc|otf|eot|woff|woff2)$">
        ExpiresActive On
        ExpiresDefault "access plus 365 days"
    Header set Cache-Control "max-age=31536000, public"
    </FilesMatch>
</IfModule>
Performance improvements step2 - web.dev PageSpeed Insights results:

Improvement step nr. 3.
Step3 included significant improvements. The website lacked HTTP cache, so adding that for the frontpage was a much-needed improvement. The website is a hibrid of PHP, React and javascript (Jquery) and the server is running on Apache. The added HTTP cache - called mod_cache - is an Apache module ( >= Apache 2.4 ), and it took care of high server response time, giving a boost to raw page load times.
Example of basic mod_cache configuration:
<IfModule mod_cache_disk.c>
    CacheRoot /cachelocation
    CacheEnable disk "/"
    CacheDirLevels 3
    CacheDirLength 2
    CacheMaxFileSize 2000000
</IfModule>
As it was mentioned earlier the website has some react components. After understanding the content, it became obvious that these components could be loaded in a better way. The Intersection Observer API is a nice feature to lazy load content just when it is needed. In addition to this it is supported by all mayor browsers. As the documentation says it can be used for many different reasons:
- Lazy-loading of images or other content as a page is scrolled.
- Implementing "infinite scrolling" web sites, where more and more content is loaded and rendered as you scroll, so that the user doesn't have to flip through pages.
- Reporting of visibility of advertisements in order to calculate ad revenues.
- Deciding whether or not to perform tasks or animation processes based on whether or not the user will see the result.
Basically the API is providing a callback function upon intersection of a target element. After adding the necessary settings, all react components are loaded only when they are needed. The provided solution also has a fallback for browsers which do not support the Intersection Observer API.
const loadIntersectionObserver = () => {
    if (typeof window.IntersectionObserver !== 'undefined') {
        const observer = new IntersectionObserver((elements) => {
        elements.forEach((element) => {
            if (element.isIntersecting) {
            observer.unobserve(element.target);
            loadReactScript(reactScriptSrc, true, false, document.body);
            }
        });
    }, {rootMargin: observerRootMargin});
    observerTarget.forEach(target => observer.observe(target));
    } else {  // Support IE11
        loadReactScript(reactScriptSrc, true, false, document.body);
    }
}
The website is on the right track:
Performance improvements step3 - WebPageTest.org results:

Performance improvements step3 - web.dev PageSpeed Insights results:

Improvement step nr. 4.
It is recommended to focus on lazy loading elements, which are not needed for the first 1-2 seconds of a website. In step nr. 3., the lazy loading of react components was already fixed, but much more can be done: a user-interaction check and lazy loading can be added to other elements too! After carefully assessing what content is crucial and what content is needed later, the following elements were also decided to be lazy loaded:
- GTM scripts
- Cookie consents modal
- ACE chat
GTM scripts
The GTM scripts proved to delay our content, so in order to serve the users better, some seconds delay was added.
document.addEventListener('DOMContentLoaded', () => {
    /** init gtm after 3500 milliseconds - this could be adjusted */
    setTimeout(initGTM, 3500);
});
In order to make sure the GTM loads if user starts interaction with the page, the following code was added to force the load to happen earlier.
document.addEventListener('scroll', initGTMOnEvent);
document.addEventListener('mousemove', initGTMOnEvent);
document.addEventListener('touchstart', initGTMOnEvent);
Cookie consents modal
The cookie consents modal caused low LCP (Largest Contentful Paint) values, and it also made that result unreliable (loading it only sometimes). It was advised that it is lazy loaded so it is for sure loaded after the page is ready. The implemented solution was similar to the GTM scripts:
- 5 second delay was added.
- Forced the load if there are any user interactions.
ACE chat
ACE chat is not as necessary as the GTM scripts or the cookie consents. Because of this, only user-interaction check was added, so that the needed scripts are only loaded if there are any interactions made by the user.
document.addEventListener('scroll', loadAllACEScripts);
document.addEventListener('mousemove', loadAllACEScripts);
document.addEventListener('touchstart', loadAllACEScripts);
Results after the final step:
Performance improvements step4 - WebPageTest.org results:

Performance improvements step4 - web.dev PageSpeed Insights results:

Future recommendations
As a general rule, analyzing the website by looking at field tests (based on the website's real users) is a must. This should be done after giving the website some time to have Google collect enough user data to provide accurate results.
There might be some issues which could not be solved for different reasons, for example:
- Fix needs newer version of Node.js
- The task would take too much time, but provide little gain.
In these cases it is wise to put together a list to summarize and remember to provide these fixes if the conditions are met. Same goes with MyCall.no - here is the list of recommended improvements for the future:
- Synchronous load above the fold css, defer load the rest.
- Consider removing Jquery, use native js for the rest.
- Analyze third party codes and only load them where it is used.
- Add mod_cache to more pages, not only to the front page.
- Implement webpack5 (server upgrade needed).
- Use Memcached instead of disk cache for mod_cache.
- Add mod_cache to API(s).
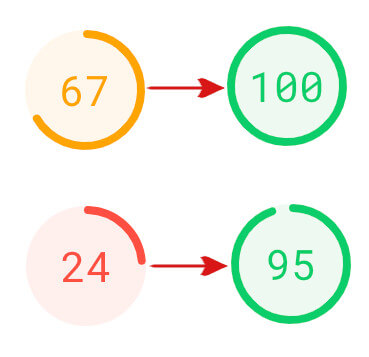
CONCLUSION
For mobile tests Pagespeed score went from 24 to around 90. For desktop this number increased from 67 to around 100. First view pageload time decreased from 4-5 seconds to 1.4-1.8 seconds.

After some months, the field test data was updated, all in the green now:

It is very important to understand that page performance improvements is not a one-time job. The technological revolution mankind faces nowadays also affects website development. Refreshing knowledge is a must if a developer wants to keep up with latest technologies. You must always be critical to your past work and try to improve it and make it up-to-date to meet the demands of the present market. If you want to be always on the top of search engines, you must reevaluate, improve, reconsider the implemented the technological solutions from time to time. Successfully improving a website's performance will eventually cause better SEO positions, increasing unique visitors, reaching higher time-on-site numbers and acquiring more customers.